%20--%3e%3cdefs%3e%3cstyle%3e%20.st0%20{%20fill:%20%23061b40;%20}%20.st1%20{%20fill:%20%23306af1;%20}%20.st2%20{%20fill:%20%235ce5cf;%20}%20%3c/style%3e%3c/defs%3e%3cg%3e%3cpath%20class='st0'%20d='M55,10.5h9v3h-9v9h12V7.5h-12v3ZM64,19.5h-6v-3h6v3Z'/%3e%3cpolygon%20class='st0'%20points='69%2016.5%2078%2016.5%2078%2019.5%2069%2019.5%2069%2022.5%2081%2022.5%2081%2013.5%2072%2013.5%2072%2010.5%2081%2010.5%2081%207.5%2069%207.5%2069%2016.5'/%3e%3cpolygon%20class='st0'%20points='95%2010.5%2095%207.5%2083%207.5%2083%2022.5%2095%2022.5%2095%2019.5%2086%2019.5%2086%2016.5%2095%2016.5%2095%2013.5%2086%2013.5%2086%2010.5%2095%2010.5'/%3e%3cpath%20class='st0'%20d='M40,1.5v21h11.6l1.4-1.4v-7.6h0c0,0-1.4-1.5-1.4-1.5l1.4-1.4V2.9l-1.4-1.4h-11.6ZM50,19.5h-7v-6h7v6ZM50,10.5h-7v-6h7v6Z'/%3e%3c/g%3e%3cpath%20class='st1'%20d='M23.1,24L14.7,4.8l-4.9,11.2h3.8l-1.8,4H3.3L12.1,0H2C.9,0,0,.9,0,2v20c0,1.1.9,2,2,2h21.1Z'/%3e%3cpath%20class='st2'%20d='M34,0h-16.8l10.6,24h6.2c1.1,0,2-.9,2-2V2C36,.9,35.1,0,34,0ZM32.5,20h-4V4h4v16Z'/%3e%3c/svg%3e)

Graphy
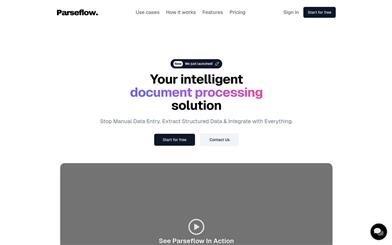
Overview :
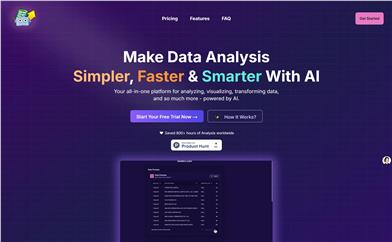
Graphy is a data visualization tool that simplifies data presentation, enabling anyone to become a proficient data storyteller. It emphasizes the actionability, clarity, and aesthetics of data, helping users make quick decisions and reduce the complexity of meetings and communication. Trusted by over 80,000 data-driven teams for its speed, ease of use, and visually appealing results.
Target Users :
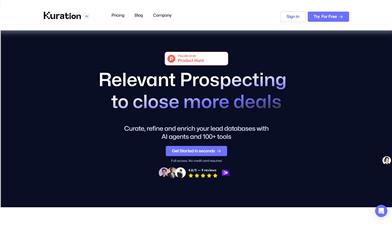
Graphy's target audience includes data analysts, product managers, market analysts, entrepreneurs, and any professionals requiring data visualization to support decision-making. It is especially suitable for teams that need to convey data insights quickly and clearly to drive business decisions.
Use Cases
Cindy Ibanez, the marketing director at Wynwood House, used Graphy to reduce a 5-day reporting task to just 4 hours.
Ryan Hoover, founder of Product Hunt, avoided creating another pivot table thanks to Graphy.
Nick Lafferty, founder of Early Exit Club, quickly created stunning visuals for his newsletters, social media, and consulting business using Graphy.
Joe Edwards, senior growth marketing manager at Venafi, found that Graphy freed them from passive data tools by providing stakeholders with the necessary context and commentary.
Features
AI-generated charts and insights: Users simply input data, and Graphy's AI creates charts and interprets key insights.
Google Sheets integration: Convenient integration with Google Sheets for direct data usage.
AI-driven insights and charts: Quickly generate charts and data insights utilizing AI technology.
API support: Offers API support for easy integration with other tools.
Dark mode and light mode support: Choose interface styles based on user preferences.
Rich storytelling features: Highlight key data points with visual annotations and one-click enhancements, such as goals and trendlines.
Multi-platform support: Share and utilize on various platforms like Notion, Canva, Slack, etc.
How to Use
1. Visit the Graphy website and create an account.
%20--%3e%3cdefs%3e%3cstyle%3e%20.st0%20{%20fill:%20%230080ff;%20}%20%3c/style%3e%3c/defs%3e%3cpath%20class='st0'%20d='M16.2,11.1c.4.5.4,1.2,0,1.8l-4.7,7.1h-3.8l5.3-8L7.6,4h3.8l4.7,7.1Z'/%3e%3c/svg%3e)
2. Once logged in, connect your Google Sheets or other data sources.
3. Select or paste your data into Graphy.
4. Use Graphy's AI features to create charts and interpret key insights.
5. Adjust the style and layout of the charts as needed.
6. Take advantage of Graphy's storytelling features to add annotations and trendlines for enhanced insights.
7. Embed the charts into your presentations, reports, or share via links.
8. When necessary, use Graphy's API for integration with other tools.

Featured AI Tools
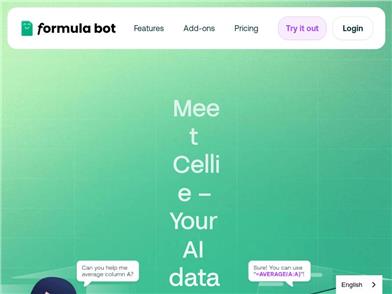
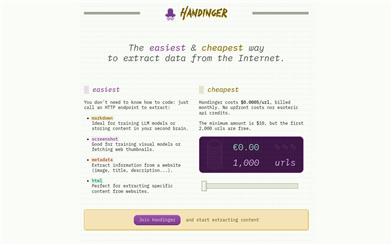
Excel Formula Bot
Formula Bot is an AI data analysis tool that integrates intelligent formula generation, data preparation, and data analysis functions. It can help users quickly generate Excel formulas, understand the explanations of different formulas, and support the application of these formulas in Excel or Google Sheets. Additionally, Formula Bot provides features for creating spreadsheet templates in various situations, generating SQL queries, executing basic task instructions, obtaining VBA or Apps Script code, and obtaining regular expressions. Through Formula Bot, users can more intelligently and efficiently handle data and spreadsheets.
AI Data Mining
181.9K
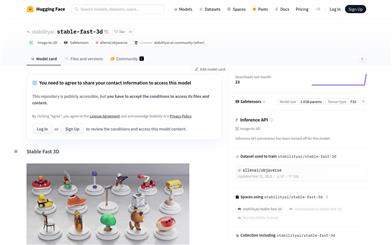
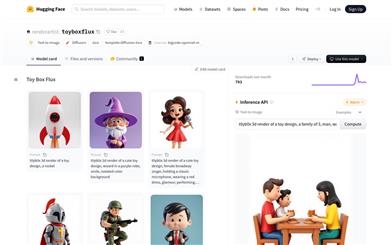
Stable Fast 3D
Stable Fast 3D (SF3D) is a large reconstruction model based on TripoSR that can create textured UV-mapped 3D mesh assets from a single object image. The model is highly trained and can produce a 3D model in less than a second, offering a low polygon count along with UV mapping and texture processing, making it easier to use the model in downstream applications such as game engines or rendering tasks. Additionally, the model predicts material parameters (roughness, metallic) for each object, enhancing reflective behaviors during rendering. SF3D is ideal for fields that require rapid 3D modeling, such as game development and visual effects production.
AI Image Generation
130.8K