%20--%3e%3cdefs%3e%3cstyle%3e%20.st0%20{%20fill:%20%23061b40;%20}%20.st1%20{%20fill:%20%23306af1;%20}%20.st2%20{%20fill:%20%235ce5cf;%20}%20%3c/style%3e%3c/defs%3e%3cg%3e%3cpath%20class='st0'%20d='M55,10.5h9v3h-9v9h12V7.5h-12v3ZM64,19.5h-6v-3h6v3Z'/%3e%3cpolygon%20class='st0'%20points='69%2016.5%2078%2016.5%2078%2019.5%2069%2019.5%2069%2022.5%2081%2022.5%2081%2013.5%2072%2013.5%2072%2010.5%2081%2010.5%2081%207.5%2069%207.5%2069%2016.5'/%3e%3cpolygon%20class='st0'%20points='95%2010.5%2095%207.5%2083%207.5%2083%2022.5%2095%2022.5%2095%2019.5%2086%2019.5%2086%2016.5%2095%2016.5%2095%2013.5%2086%2013.5%2086%2010.5%2095%2010.5'/%3e%3cpath%20class='st0'%20d='M40,1.5v21h11.6l1.4-1.4v-7.6h0c0,0-1.4-1.5-1.4-1.5l1.4-1.4V2.9l-1.4-1.4h-11.6ZM50,19.5h-7v-6h7v6ZM50,10.5h-7v-6h7v6Z'/%3e%3c/g%3e%3cpath%20class='st1'%20d='M23.1,24L14.7,4.8l-4.9,11.2h3.8l-1.8,4H3.3L12.1,0H2C.9,0,0,.9,0,2v20c0,1.1.9,2,2,2h21.1Z'/%3e%3cpath%20class='st2'%20d='M34,0h-16.8l10.6,24h6.2c1.1,0,2-.9,2-2V2C36,.9,35.1,0,34,0ZM32.5,20h-4V4h4v16Z'/%3e%3c/svg%3e)

Datamonkey
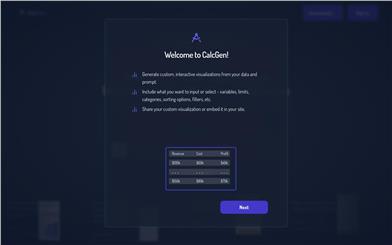
Overview :
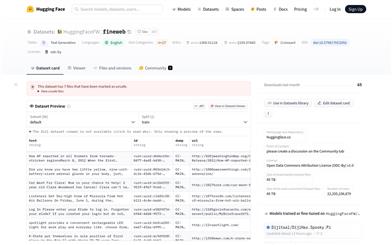
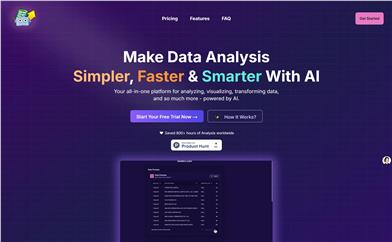
DataMonkey is an innovative data visualization platform that allows users to access public datasets through a chat interface for Map-based data analysis and presentation. With its intuitive navigation and elegant design, DataMonkey offers users an efficient and creative way to process and present data. It supports unlimited data visualizations, allows users to upload files, and integrates open data, significantly enhancing the flexibility and convenience of data handling.
Target Users :
The target audience for DataMonkey primarily includes professionals such as data analysts, geospatial consultants, and data scientists. These users need to handle and analyze large volumes of data while presenting the results in an intuitive manner. The Map-based data visualization feature provided by DataMonkey simplifies the understanding and sharing of complex data relationships, making it particularly suitable for professionals who require geospatial analysis and data visualization presentations.
Use Cases
Geospatial analysts use DataMonkey for data analysis and presentation in urban development planning.
Data scientists utilize the platform for real-time presentation and analysis of environmental monitoring data.
Business analysts visualize market data through DataMonkey to aid decision-making.
Features
Unlimited file uploads with support for various data formats.
Integration of open datasets for easy access to external data sources.
Intuitive data visualization with support for Map presentations.
User-customizable data views for enhanced personalization.
7-day free trial available, allowing users to experience the platform's features beforehand.
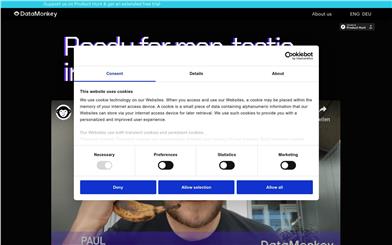
Elegant interface design with easy operation, improving user experience.
Cross-device access support with data synchronization, enabling users to view analysis results anytime, anywhere.
How to Use
1. Visit the DataMonkey official website and register an account.
%20--%3e%3cdefs%3e%3cstyle%3e%20.st0%20{%20fill:%20%230080ff;%20}%20%3c/style%3e%3c/defs%3e%3cpath%20class='st0'%20d='M16.2,11.1c.4.5.4,1.2,0,1.8l-4.7,7.1h-3.8l5.3-8L7.6,4h3.8l4.7,7.1Z'/%3e%3c/svg%3e)
2. After logging in, select 'Start your 7-day free trial' to begin your trial.
3. Upload or connect the necessary data files for analysis on the platform.
4. Utilize the data visualization tools offered on the platform to create Map views.
5. Adjust the Map style and data presentation as needed for in-depth analysis.
6. Share or export the analysis results for reports or presentations.

Featured AI Tools
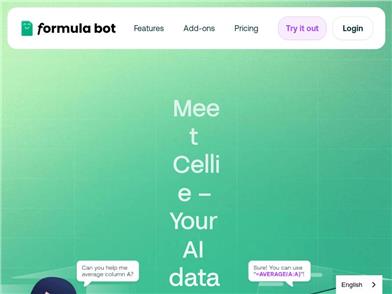
Excel Formula Bot
Formula Bot is an AI data analysis tool that integrates intelligent formula generation, data preparation, and data analysis functions. It can help users quickly generate Excel formulas, understand the explanations of different formulas, and support the application of these formulas in Excel or Google Sheets. Additionally, Formula Bot provides features for creating spreadsheet templates in various situations, generating SQL queries, executing basic task instructions, obtaining VBA or Apps Script code, and obtaining regular expressions. Through Formula Bot, users can more intelligently and efficiently handle data and spreadsheets.
AI Data Mining
181.3K
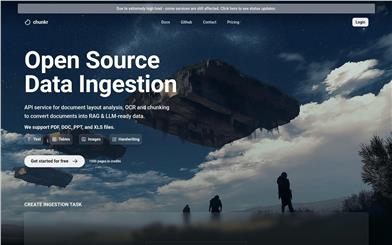
Chunkr
Chunkr is an open-source data ingestion API service focused on document layout analysis, OCR, and chunk processing, transforming documents into formats suitable for RAG and LLM. It supports PDF, DOC, PPT, and XLS files. The service can structure text, tables, images, and handwritten content, providing data support for AI and machine learning applications. It is maintained by Lumina AI Inc. and offers a free trial and pricing plans.
AI Data Mining
127.5K