%20--%3e%3cdefs%3e%3cstyle%3e%20.st0%20{%20fill:%20%23061b40;%20}%20.st1%20{%20fill:%20%23306af1;%20}%20.st2%20{%20fill:%20%235ce5cf;%20}%20%3c/style%3e%3c/defs%3e%3cg%3e%3cpath%20class='st0'%20d='M55,10.5h9v3h-9v9h12V7.5h-12v3ZM64,19.5h-6v-3h6v3Z'/%3e%3cpolygon%20class='st0'%20points='69%2016.5%2078%2016.5%2078%2019.5%2069%2019.5%2069%2022.5%2081%2022.5%2081%2013.5%2072%2013.5%2072%2010.5%2081%2010.5%2081%207.5%2069%207.5%2069%2016.5'/%3e%3cpolygon%20class='st0'%20points='95%2010.5%2095%207.5%2083%207.5%2083%2022.5%2095%2022.5%2095%2019.5%2086%2019.5%2086%2016.5%2095%2016.5%2095%2013.5%2086%2013.5%2086%2010.5%2095%2010.5'/%3e%3cpath%20class='st0'%20d='M40,1.5v21h11.6l1.4-1.4v-7.6h0c0,0-1.4-1.5-1.4-1.5l1.4-1.4V2.9l-1.4-1.4h-11.6ZM50,19.5h-7v-6h7v6ZM50,10.5h-7v-6h7v6Z'/%3e%3c/g%3e%3cpath%20class='st1'%20d='M23.1,24L14.7,4.8l-4.9,11.2h3.8l-1.8,4H3.3L12.1,0H2C.9,0,0,.9,0,2v20c0,1.1.9,2,2,2h21.1Z'/%3e%3cpath%20class='st2'%20d='M34,0h-16.8l10.6,24h6.2c1.1,0,2-.9,2-2V2C36,.9,35.1,0,34,0ZM32.5,20h-4V4h4v16Z'/%3e%3c/svg%3e)

Gitdiagram
Overview :
GitDiagram is an online tool that converts any GitHub repository into an interactive chart, enabling users to quickly understand and visualize project structures. This tool is crucial for developers and project managers as it helps them gain insights into the organization of codebases and their dependencies. GitDiagram was created by developer Ahmed Khaleel and can be accessed via API and GitHub. Currently, the tool is free to use, and users can utilize it by replacing 'hub' with 'diagram' in the GitHub URL.
Target Users :
The target audience includes developers, project managers, educators, and students. Developers and project managers can quickly understand project structures and optimize development processes using GitDiagram. Educators and students can leverage it to learn how to manage and comprehend complex codebases.
Use Cases
Example 1: A developer using the FastAPI framework visualizes his API project structure with GitDiagram.
Example 2: A project management team uses GitDiagram to showcase code organization and dependencies to new members.
Example 3: A computer science professor employs GitDiagram in class to demonstrate how to understand and analyze the code structure of open-source projects.
Features
- Convert GitHub repositories into interactive charts: Users can input their GitHub repository address, and GitDiagram will generate the corresponding interactive chart.
- Quick project visualization: Helps users swiftly grasp the overall structure and details of a project.
- Supports multiple programming languages and frameworks: Such as FastAPI, Streamlit, Flask, etc., making it convenient for users from different tech stacks.
- Easy to understand and use: The user interface is simple, making it easy to get started without complex configurations.
- API access support: Developers can interact with GitDiagram through its API for automated chart generation.
- Community support: The project is open-source on GitHub, welcoming community feedback and contributions for continuous updates and improvements.
- Educational and learning tool: Ideal for educators and students to understand complex codebase structures.
How to Use
1. Visit the GitDiagram official website: https://gitdiagram.com/.
%20--%3e%3cdefs%3e%3cstyle%3e%20.st0%20{%20fill:%20%230080ff;%20}%20%3c/style%3e%3c/defs%3e%3cpath%20class='st0'%20d='M16.2,11.1c.4.5.4,1.2,0,1.8l-4.7,7.1h-3.8l5.3-8L7.6,4h3.8l4.7,7.1Z'/%3e%3c/svg%3e)
2. Locate the 'Repository to diagram' section on the page.
3. Enter your GitHub repository address.
4. Click the 'Diagram' button to generate an interactive chart.
5. Explore the generated chart to understand the project's structure and dependencies.
6. If needed, access GitDiagram through its API for automated chart generation and analysis.
7. Explore projects on GitHub by replacing 'hub' in the URL with 'diagram' to directly generate charts.


Featured AI Tools
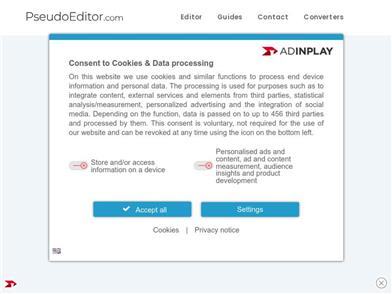
Pseudoeditor
PseudoEditor is a free online pseudocode editor. It features syntax highlighting and auto-completion, making it easier for you to write pseudocode. You can also use our pseudocode compiler feature to test your code. No download is required, start using it immediately.
Development & Tools
3.8M

Coze
Coze is a next-generation AI chatbot building platform that enables the rapid creation, debugging, and optimization of AI chatbot applications. Users can quickly build bots without writing code and deploy them across multiple platforms. Coze also offers a rich set of plugins that can extend the capabilities of bots, allowing them to interact with data, turn ideas into bot skills, equip bots with long-term memory, and enable bots to initiate conversations.
Development & Tools
3.8M