%20--%3e%3cdefs%3e%3cstyle%3e%20.st0%20{%20fill:%20%23061b40;%20}%20.st1%20{%20fill:%20%23306af1;%20}%20.st2%20{%20fill:%20%235ce5cf;%20}%20%3c/style%3e%3c/defs%3e%3cg%3e%3cpath%20class='st0'%20d='M55,10.5h9v3h-9v9h12V7.5h-12v3ZM64,19.5h-6v-3h6v3Z'/%3e%3cpolygon%20class='st0'%20points='69%2016.5%2078%2016.5%2078%2019.5%2069%2019.5%2069%2022.5%2081%2022.5%2081%2013.5%2072%2013.5%2072%2010.5%2081%2010.5%2081%207.5%2069%207.5%2069%2016.5'/%3e%3cpolygon%20class='st0'%20points='95%2010.5%2095%207.5%2083%207.5%2083%2022.5%2095%2022.5%2095%2019.5%2086%2019.5%2086%2016.5%2095%2016.5%2095%2013.5%2086%2013.5%2086%2010.5%2095%2010.5'/%3e%3cpath%20class='st0'%20d='M40,1.5v21h11.6l1.4-1.4v-7.6h0c0,0-1.4-1.5-1.4-1.5l1.4-1.4V2.9l-1.4-1.4h-11.6ZM50,19.5h-7v-6h7v6ZM50,10.5h-7v-6h7v6Z'/%3e%3c/g%3e%3cpath%20class='st1'%20d='M23.1,24L14.7,4.8l-4.9,11.2h3.8l-1.8,4H3.3L12.1,0H2C.9,0,0,.9,0,2v20c0,1.1.9,2,2,2h21.1Z'/%3e%3cpath%20class='st2'%20d='M34,0h-16.8l10.6,24h6.2c1.1,0,2-.9,2-2V2C36,.9,35.1,0,34,0ZM32.5,20h-4V4h4v16Z'/%3e%3c/svg%3e)


Haiva Analytics Agent
Overview :
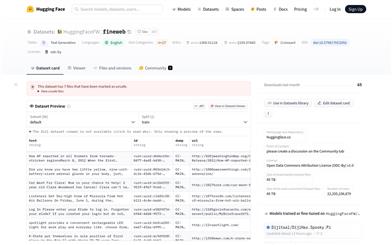
Haiva Analytics Agent is an analytical tool that provides real-time data insights by connecting to multiple databases and third-party applications, enabling businesses to instantly access key information and helping teams make faster and more informed decisions. It supports various chart types, simplifying data visualization and allowing businesses to easily identify trends and opportunities. By automating routine analysis tasks and providing a no-code self-service platform for deeper insights, it ensures that companies remain agile, data-driven, and ahead of their competitors.
Target Users :
The target audience includes corporate decision-makers, data analysts, and IT professionals. Haiva Analytics Agent helps them rapidly access critical data, streamline the data analysis process, and enhance decision-making efficiency, especially suited for business environments that require real-time data analysis and data-driven decisions.
Use Cases
Companies use Haiva Analytics Agent to monitor sales data and promptly adjust sales strategies.
Market analysts leverage Haiva Analytics Agent to analyze user behavior and optimize product promotions.
IT departments utilize Haiva Analytics Agent to monitor system performance and proactively identify and resolve issues.
Features
Supports connections to multiple databases, including MySQL, MS SQL Server, and PostgreSQL.
Offers a variety of chart types such as bar charts, pie charts, line graphs, scatter plots, and bubble charts.
Supports data retrieval via free text or voice commands.
Charts can be exported in formats including PDF, PNG, JPEG, and SVG.
Allows the creation of multilingual analytical agents without coding.
Provides real-time data analysis to help businesses make swift decisions.
Facilitates the automation of routine analysis tasks, enhancing work efficiency.
How to Use
Visit the official Haiva Analytics Agent website.
%20--%3e%3cdefs%3e%3cstyle%3e%20.st0%20{%20fill:%20%230080ff;%20}%20%3c/style%3e%3c/defs%3e%3cpath%20class='st0'%20d='M16.2,11.1c.4.5.4,1.2,0,1.8l-4.7,7.1h-3.8l5.3-8L7.6,4h3.8l4.7,7.1Z'/%3e%3c/svg%3e)
Register and log in to your account.
Select the databases and third-party applications you wish to connect to.
Set the query conditions for data retrieval.
Choose the chart type and configure the chart parameters.
Retrieve data using free text or voice commands.
View the analysis results and export the charts as needed.
Utilize the self-service platform to further customize the analysis process.

Featured AI Tools

Excel Formula Bot
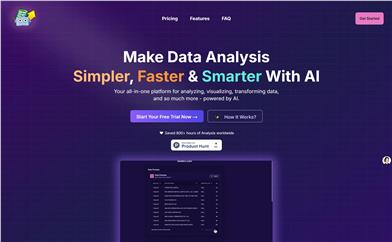
Formula Bot is an AI data analysis tool that integrates intelligent formula generation, data preparation, and data analysis functions. It can help users quickly generate Excel formulas, understand the explanations of different formulas, and support the application of these formulas in Excel or Google Sheets. Additionally, Formula Bot provides features for creating spreadsheet templates in various situations, generating SQL queries, executing basic task instructions, obtaining VBA or Apps Script code, and obtaining regular expressions. Through Formula Bot, users can more intelligently and efficiently handle data and spreadsheets.
AI Data Mining
181.9K
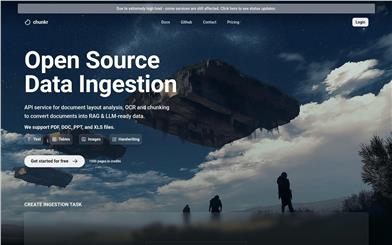
Chunkr
Chunkr is an open-source data ingestion API service focused on document layout analysis, OCR, and chunk processing, transforming documents into formats suitable for RAG and LLM. It supports PDF, DOC, PPT, and XLS files. The service can structure text, tables, images, and handwritten content, providing data support for AI and machine learning applications. It is maintained by Lumina AI Inc. and offers a free trial and pricing plans.
AI Data Mining
128.3K