%20--%3e%3cdefs%3e%3cstyle%3e%20.st0%20{%20fill:%20%23061b40;%20}%20.st1%20{%20fill:%20%23306af1;%20}%20.st2%20{%20fill:%20%235ce5cf;%20}%20%3c/style%3e%3c/defs%3e%3cg%3e%3cpath%20class='st0'%20d='M55,10.5h9v3h-9v9h12V7.5h-12v3ZM64,19.5h-6v-3h6v3Z'/%3e%3cpolygon%20class='st0'%20points='69%2016.5%2078%2016.5%2078%2019.5%2069%2019.5%2069%2022.5%2081%2022.5%2081%2013.5%2072%2013.5%2072%2010.5%2081%2010.5%2081%207.5%2069%207.5%2069%2016.5'/%3e%3cpolygon%20class='st0'%20points='95%2010.5%2095%207.5%2083%207.5%2083%2022.5%2095%2022.5%2095%2019.5%2086%2019.5%2086%2016.5%2095%2016.5%2095%2013.5%2086%2013.5%2086%2010.5%2095%2010.5'/%3e%3cpath%20class='st0'%20d='M40,1.5v21h11.6l1.4-1.4v-7.6h0c0,0-1.4-1.5-1.4-1.5l1.4-1.4V2.9l-1.4-1.4h-11.6ZM50,19.5h-7v-6h7v6ZM50,10.5h-7v-6h7v6Z'/%3e%3c/g%3e%3cpath%20class='st1'%20d='M23.1,24L14.7,4.8l-4.9,11.2h3.8l-1.8,4H3.3L12.1,0H2C.9,0,0,.9,0,2v20c0,1.1.9,2,2,2h21.1Z'/%3e%3cpath%20class='st2'%20d='M34,0h-16.8l10.6,24h6.2c1.1,0,2-.9,2-2V2C36,.9,35.1,0,34,0ZM32.5,20h-4V4h4v16Z'/%3e%3c/svg%3e)

Data Formulator
Overview :
Data Formulator is an AI-driven data visualization tool developed by the Microsoft Research team. It combines user interface interactions and natural language input to help users quickly create rich data visualization charts. The tool automates data transformations, allowing users to focus on chart design. Data Formulator can be installed and run locally via Python and can also be quickly launched on GitHub Codespaces. It represents a technological advance in the field of data analysis and visualization, enhancing the efficiency and user-friendliness of data visualization through AI technology.
Target Users :
Data Formulator is designed for data analysts, researchers, and developers. It simplifies the data visualization process, enabling non-experts to quickly create professional data charts, while providing powerful data processing and visualization capabilities for professional users.
Use Cases
Data analysts quickly create bar charts for sales data using Data Formulator.
Researchers utilize Data Formulator to extract insights from complex data and generate trend analysis charts.
Developers launch Data Formulator in GitHub Codespaces for prototyping data visualizations.
Features
- Supports local installation via Python PIP.
- Can be quickly launched on GitHub Codespaces with pre-configured environments.
- Combines user interface interactions and natural language input to simplify the chart design process.
- Supports iterative creation of data transformations and visualizations.
- Allows users to articulate chart design intentions through natural language prompts.
- Provides a data threads panel to track the exploration process.
- Supports loading images or messy text for AI parsing and cleaning.
How to Use
1. Install Data Formulator via Python PIP: Run the command 'pip install data_formulator' in the terminal.
%20--%3e%3cdefs%3e%3cstyle%3e%20.st0%20{%20fill:%20%230080ff;%20}%20%3c/style%3e%3c/defs%3e%3cpath%20class='st0'%20d='M16.2,11.1c.4.5.4,1.2,0,1.8l-4.7,7.1h-3.8l5.3-8L7.6,4h3.8l4.7,7.1Z'/%3e%3c/svg%3e)
2. Launch Data Formulator: After installation, run the command 'data_formulator' or 'python -m data_formulator'.
3. Access Data Formulator: It will open in your local browser, typically at 'http://localhost:5000'.
4. Enter OpenAI key and select a model: Input the necessary API key in the Data Formulator interface and choose an AI model.
5. Choose a dataset and chart type: Upload your dataset and select the desired chart type.
6. Drag and drop data fields to chart properties: Place the data fields into the relevant properties of the chart as needed.
7. Refine chart design using natural language prompts: If necessary, further guide the AI in generating the chart by entering natural language prompts.
8. Review and iterate on data visualization: Monitor and track your data visualization process in the Data Threads panel, iterating as needed.


Featured AI Tools
Pseudoeditor
PseudoEditor is a free online pseudocode editor. It features syntax highlighting and auto-completion, making it easier for you to write pseudocode. You can also use our pseudocode compiler feature to test your code. No download is required, start using it immediately.
Development & Tools
3.8M

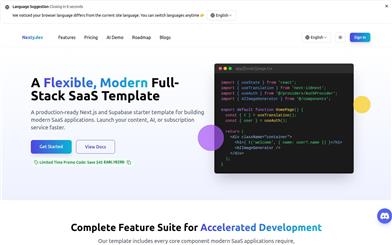
Coze
Coze is a next-generation AI chatbot building platform that enables the rapid creation, debugging, and optimization of AI chatbot applications. Users can quickly build bots without writing code and deploy them across multiple platforms. Coze also offers a rich set of plugins that can extend the capabilities of bots, allowing them to interact with data, turn ideas into bot skills, equip bots with long-term memory, and enable bots to initiate conversations.
Development & Tools
3.8M