%20--%3e%3cdefs%3e%3cstyle%3e%20.st0%20{%20fill:%20%23061b40;%20}%20.st1%20{%20fill:%20%23306af1;%20}%20.st2%20{%20fill:%20%235ce5cf;%20}%20%3c/style%3e%3c/defs%3e%3cg%3e%3cpath%20class='st0'%20d='M55,10.5h9v3h-9v9h12V7.5h-12v3ZM64,19.5h-6v-3h6v3Z'/%3e%3cpolygon%20class='st0'%20points='69%2016.5%2078%2016.5%2078%2019.5%2069%2019.5%2069%2022.5%2081%2022.5%2081%2013.5%2072%2013.5%2072%2010.5%2081%2010.5%2081%207.5%2069%207.5%2069%2016.5'/%3e%3cpolygon%20class='st0'%20points='95%2010.5%2095%207.5%2083%207.5%2083%2022.5%2095%2022.5%2095%2019.5%2086%2019.5%2086%2016.5%2095%2016.5%2095%2013.5%2086%2013.5%2086%2010.5%2095%2010.5'/%3e%3cpath%20class='st0'%20d='M40,1.5v21h11.6l1.4-1.4v-7.6h0c0,0-1.4-1.5-1.4-1.5l1.4-1.4V2.9l-1.4-1.4h-11.6ZM50,19.5h-7v-6h7v6ZM50,10.5h-7v-6h7v6Z'/%3e%3c/g%3e%3cpath%20class='st1'%20d='M23.1,24L14.7,4.8l-4.9,11.2h3.8l-1.8,4H3.3L12.1,0H2C.9,0,0,.9,0,2v20c0,1.1.9,2,2,2h21.1Z'/%3e%3cpath%20class='st2'%20d='M34,0h-16.8l10.6,24h6.2c1.1,0,2-.9,2-2V2C36,.9,35.1,0,34,0ZM32.5,20h-4V4h4v16Z'/%3e%3c/svg%3e)

Data Commons
Overview :
Data Commons is a powerful public data platform designed to provide a unified knowledge graph by integrating global public data, helping users easily explore and analyze data. Initiated by Google, it supports the integration of multiple data sources and offers a variety of visualization tools and APIs, facilitating data exploration and research. The key advantage of Data Commons is the standardization and unification of data, allowing users to quickly access and analyze data without complex preprocessing. Additionally, it supports community contributions, enabling users to share their analyses and insights to advance the field of data science. Data Commons is suitable for researchers, data analysts, policymakers, and any group that needs public data to support decision-making. Its free access model lowers the barriers to data usage, promoting widespread dissemination and application of data.
Target Users :
Data Commons is suitable for researchers, data analysts, policymakers, and any group that requires public data to support decision-making. It provides users with a unified data platform that simplifies the process of data acquisition and analysis, lowers the barriers to data usage, and enables users to quickly obtain and analyze global public data, thereby better supporting research, policy formulation, and decision-making.
Use Cases
The United Nations utilizes Data Commons to build a platform for tracking global progress on sustainable development goals.
Researchers analyze the economic data of different countries through Data Commons to study economic trends.
Educational institutions assess the education levels and resource allocation in different regions using the education data provided by Data Commons.
Features
Knowledge Graph Exploration: Users can explore the structure and relationships of data through the Knowledge Graph Explorer.
Data Download: Provides data download tools that allow users to download interested statistical variable data locally.
Map Visualization: Use the Map Explorer to study variations of statistical variables across different geographical regions.
Scatter Plot Analysis: Visualize the correlation between two statistical variables using the Scatter Plot Explorer.
Timeline Analysis: View the trend changes of selected statistical variables over time using the Timeline Explorer.
How to Use
1. Visit the official Data Commons website and select a data topic of interest, such as economy, population, health, etc.
%20--%3e%3cdefs%3e%3cstyle%3e%20.st0%20{%20fill:%20%230080ff;%20}%20%3c/style%3e%3c/defs%3e%3cpath%20class='st0'%20d='M16.2,11.1c.4.5.4,1.2,0,1.8l-4.7,7.1h-3.8l5.3-8L7.6,4h3.8l4.7,7.1Z'/%3e%3c/svg%3e)
2. Use the Knowledge Graph Explorer to explore the data structure and understand the relationships between different datasets.
3. Choose the appropriate tools, such as the Map Explorer, Scatter Plot Explorer, or Timeline Explorer, for data visualization and analysis.
4. If necessary, use the data download tool to export the data for further analysis locally.
5. Refer to the official documentation and tutorials to learn how to use the API for programmatic data access and analysis.

Featured AI Tools
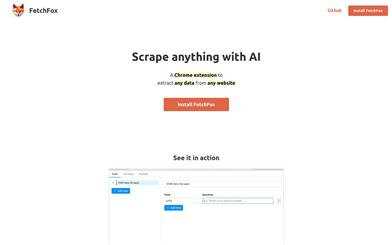
Fetchfox
FetchFox is an AI-driven web scraping tool. It leverages AI to extract the data you need from raw web pages. Running as a Chrome extension, users can simply describe the desired data in English. With FetchFox, you can quickly collect data such as building lead lists, gathering research data, or surveying market segments. By using AI to scrape from raw text, FetchFox can bypass anti-scraping measures on websites like LinkedIn and Facebook. It can easily parse even the most complex HTML structures.
Data Analysis
413.2K
Comments Analytics
Comments Analyzer is a tool that helps users extract and analyze page comments. It utilizes artificial intelligence technology to extract and quantify emotional information from comments, providing functionalities such as sentiment analysis, entity recognition, and keyword extraction. By analyzing comments, users can understand customer thoughts, feelings, and decision-making processes, ultimately leading to improved customer experience and product or service optimization.
Data Analysis
316.6K