%20--%3e%3cdefs%3e%3cstyle%3e%20.st0%20{%20fill:%20%23061b40;%20}%20.st1%20{%20fill:%20%23306af1;%20}%20.st2%20{%20fill:%20%235ce5cf;%20}%20%3c/style%3e%3c/defs%3e%3cg%3e%3cpath%20class='st0'%20d='M55,10.5h9v3h-9v9h12V7.5h-12v3ZM64,19.5h-6v-3h6v3Z'/%3e%3cpolygon%20class='st0'%20points='69%2016.5%2078%2016.5%2078%2019.5%2069%2019.5%2069%2022.5%2081%2022.5%2081%2013.5%2072%2013.5%2072%2010.5%2081%2010.5%2081%207.5%2069%207.5%2069%2016.5'/%3e%3cpolygon%20class='st0'%20points='95%2010.5%2095%207.5%2083%207.5%2083%2022.5%2095%2022.5%2095%2019.5%2086%2019.5%2086%2016.5%2095%2016.5%2095%2013.5%2086%2013.5%2086%2010.5%2095%2010.5'/%3e%3cpath%20class='st0'%20d='M40,1.5v21h11.6l1.4-1.4v-7.6h0c0,0-1.4-1.5-1.4-1.5l1.4-1.4V2.9l-1.4-1.4h-11.6ZM50,19.5h-7v-6h7v6ZM50,10.5h-7v-6h7v6Z'/%3e%3c/g%3e%3cpath%20class='st1'%20d='M23.1,24L14.7,4.8l-4.9,11.2h3.8l-1.8,4H3.3L12.1,0H2C.9,0,0,.9,0,2v20c0,1.1.9,2,2,2h21.1Z'/%3e%3cpath%20class='st2'%20d='M34,0h-16.8l10.6,24h6.2c1.1,0,2-.9,2-2V2C36,.9,35.1,0,34,0ZM32.5,20h-4V4h4v16Z'/%3e%3c/svg%3e)

Rlloggingboard
Overview :
RLLoggingBoard is a tool focused on visualizing the reinforcement learning human feedback (RLHF) training process. It aids researchers and developers in intuitively understanding the training procedure through fine-grained metric monitoring, quickly identifying issues, and optimizing training outcomes. The tool supports various visualization modules, including reward curves, response rankings, and token-level metrics, aiming to augment existing training frameworks and enhance efficiency and effectiveness. It is compatible with any training framework that supports saving the required metrics, boasting high flexibility and scalability.
Target Users :
This product is designed for professionals engaged in research and development of reinforcement learning, especially those who require in-depth monitoring and debugging of the RLHF training process. It assists them in quickly pinpointing issues, optimizing training strategies, and enhancing model performance.
Use Cases
In a rhyming task, use the visualization tool to analyze whether the generated lines of poetry meet the rhyming criteria, optimizing the training process.
In a dialogue generation task, monitor the quality of generated dialogues and analyze the model's convergence via reward distribution.
In a text generation task, utilize token-level metrics to identify and resolve issues with anomalous tokens in the generated text.
Features
Reward Area Visualization: Displays training curves, score distributions, and discrepancies with reference model rewards.
Response Area Visualization: Sorts responses based on metrics like rewards and KL divergence to analyze each sample's characteristics.
Token Level Monitoring: Presents fine-grained metrics such as rewards, values, and probabilities for each token.
Supports Multiple Training Frameworks: Decoupled from training frameworks, adaptable to any framework that saves the required metrics.
Flexible Data Format: Supports .jsonl file format, facilitating integration with existing training processes.
Optional Reference Model Comparison: Supports saving metrics from reference models for comparative analysis with RL models.
Intuitively Identify Potential Issues: Quickly locates anomalies and problems in training through visualization techniques.
Supports Multiple Visualization Modules: Offers a rich array of visualization functionalities to meet various monitoring needs.
How to Use
1. Save the required metric data to a .jsonl file within your training framework.
%20--%3e%3cdefs%3e%3cstyle%3e%20.st0%20{%20fill:%20%230080ff;%20}%20%3c/style%3e%3c/defs%3e%3cpath%20class='st0'%20d='M16.2,11.1c.4.5.4,1.2,0,1.8l-4.7,7.1h-3.8l5.3-8L7.6,4h3.8l4.7,7.1Z'/%3e%3c/svg%3e)
2. Save the data file to the specified directory.
3. Install the necessary dependencies (run pip install -r requirements.txt).
4. Execute the startup script (bash start.sh).
5. Access the visualization interface through a web browser and select the data folder for analysis.
6. Use the visualization module to view reward curves, response rankings, and token-level metrics.
7. Analyze training issues based on visualization results and optimize training strategies.
8. Continuously monitor the training process to ensure model performance meets expectations.


Featured AI Tools
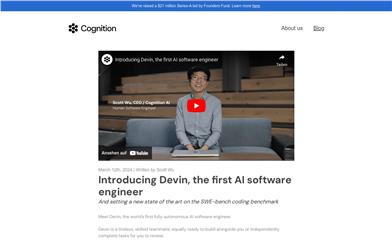
Devin
Devin is the world's first fully autonomous AI software engineer. With long-term reasoning and planning capabilities, Devin can execute complex engineering tasks and collaborate with users in real time. It empowers engineers to focus on more engaging problems and helps engineering teams achieve greater objectives.
Development and Tools
1.7M
Chinese Picks

Foxkit GPT AI Creation System
FoxKit GPT AI Creation System is a completely open-source system that supports independent secondary development. The system framework is developed using ThinkPHP6 + Vue-admin and provides application ends such as WeChat mini-programs, mobile H5, PC website, and official accounts. Sora video generation interface has been reserved. The system provides detailed installation and deployment documents, parameter configuration documents, and one free setup service.
Development and Tools
752.1K