%20--%3e%3cdefs%3e%3cstyle%3e%20.st0%20{%20fill:%20%23061b40;%20}%20.st1%20{%20fill:%20%23306af1;%20}%20.st2%20{%20fill:%20%235ce5cf;%20}%20%3c/style%3e%3c/defs%3e%3cg%3e%3cpath%20class='st0'%20d='M55,10.5h9v3h-9v9h12V7.5h-12v3ZM64,19.5h-6v-3h6v3Z'/%3e%3cpolygon%20class='st0'%20points='69%2016.5%2078%2016.5%2078%2019.5%2069%2019.5%2069%2022.5%2081%2022.5%2081%2013.5%2072%2013.5%2072%2010.5%2081%2010.5%2081%207.5%2069%207.5%2069%2016.5'/%3e%3cpolygon%20class='st0'%20points='95%2010.5%2095%207.5%2083%207.5%2083%2022.5%2095%2022.5%2095%2019.5%2086%2019.5%2086%2016.5%2095%2016.5%2095%2013.5%2086%2013.5%2086%2010.5%2095%2010.5'/%3e%3cpath%20class='st0'%20d='M40,1.5v21h11.6l1.4-1.4v-7.6h0c0,0-1.4-1.5-1.4-1.5l1.4-1.4V2.9l-1.4-1.4h-11.6ZM50,19.5h-7v-6h7v6ZM50,10.5h-7v-6h7v6Z'/%3e%3c/g%3e%3cpath%20class='st1'%20d='M23.1,24L14.7,4.8l-4.9,11.2h3.8l-1.8,4H3.3L12.1,0H2C.9,0,0,.9,0,2v20c0,1.1.9,2,2,2h21.1Z'/%3e%3cpath%20class='st2'%20d='M34,0h-16.8l10.6,24h6.2c1.1,0,2-.9,2-2V2C36,.9,35.1,0,34,0ZM32.5,20h-4V4h4v16Z'/%3e%3c/svg%3e)

Viz Graph Maker
Overview :
Viz Graph Maker is a tool that leverages artificial intelligence technology to assist users in quickly creating a wide range of charts. It supports various chart types, including bar charts, pie charts, and line charts, while offering a user-friendly interface and customization options. This product simplifies the chart creation process through AI technology, improving the efficiency and accuracy of data visualization. It is suitable for professionals and general users requiring quick and accurate data presentation, allowing high-quality charts to be generated without complex operations.
Target Users :
The target audience includes professionals such as data analysts, project managers, market researchers, and educators who require data visualization. Viz Graph Maker simplifies the process of creating charts, enabling non-professionals to easily generate professional-quality charts, thereby enhancing efficiency and the quality of data presentation.
Use Cases
Market researchers use Viz Graph Maker to create bar charts of sales data for market analysis.
Project managers utilize Gantt chart features to plan and track project progress.
Educators employ mind map functions to organize course content and teaching plans.
Features
Supports various chart types such as bar charts, pie charts, line charts, etc.
AI-driven automated chart generation, enabling quick chart creation with input data.
Provides customization options for charts, including colors, labels, and more.
Supports multiple format exports of the charts, such as PNG, SVG, and Mermaid.
Responsive design adapting to various devices.
User-friendly interface suitable for both beginners and professionals.
Diverse chart options to meet different data presentation needs.
How to Use
1. Visit the Viz Graph Maker website and log in.
%20--%3e%3cdefs%3e%3cstyle%3e%20.st0%20{%20fill:%20%230080ff;%20}%20%3c/style%3e%3c/defs%3e%3cpath%20class='st0'%20d='M16.2,11.1c.4.5.4,1.2,0,1.8l-4.7,7.1h-3.8l5.3-8L7.6,4h3.8l4.7,7.1Z'/%3e%3c/svg%3e)
2. Select the type of chart you wish to create.
3. Input or upload the relevant data.
4. The AI will automatically analyze the data and generate the chart.
5. Edit the chart's colors, labels, and other elements as needed.
6. Export or share the generated chart.
7. Use the chart in reports, presentations, or other materials.

Featured AI Tools
Chinese Picks
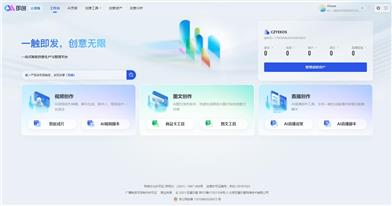
Douyin Jicuo
Jicuo Workspace is an all-in-one intelligent creative production and management platform. It integrates various creative tools like video, text, and live streaming creation. Through the power of AI, it can significantly increase creative efficiency. Key features and advantages include:
1. **Video Creation:** Built-in AI video creation tools support intelligent scripting, digital human characters, and one-click video generation, allowing for the rapid creation of high-quality video content.
2. **Text Creation:** Provides intelligent text and product image generation tools, enabling the quick production of WeChat articles, product details, and other text-based content.
3. **Live Streaming Creation:** Supports AI-powered live streaming backgrounds and scripts, making it easy to create live streaming content for platforms like Douyin and Kuaishou. Jicuo is positioned as a creative assistant for newcomers and creative professionals, providing comprehensive creative production services at a reasonable price.
AI design tools
105.1M

Promeai
PromeAI is powered by a robust AI-driven design assistant and a vast library of controllable AIGC (C-AIGC) model styles. It enables you to effortlessly create stunning graphics, videos, and animations, making it an indispensable tool for architects, interior designers, product designers, and game & animation designers.
AI design tools
6.5M