%20--%3e%3cdefs%3e%3cstyle%3e%20.st0%20{%20fill:%20%23061b40;%20}%20.st1%20{%20fill:%20%23306af1;%20}%20.st2%20{%20fill:%20%235ce5cf;%20}%20%3c/style%3e%3c/defs%3e%3cg%3e%3cpath%20class='st0'%20d='M55,10.5h9v3h-9v9h12V7.5h-12v3ZM64,19.5h-6v-3h6v3Z'/%3e%3cpolygon%20class='st0'%20points='69%2016.5%2078%2016.5%2078%2019.5%2069%2019.5%2069%2022.5%2081%2022.5%2081%2013.5%2072%2013.5%2072%2010.5%2081%2010.5%2081%207.5%2069%207.5%2069%2016.5'/%3e%3cpolygon%20class='st0'%20points='95%2010.5%2095%207.5%2083%207.5%2083%2022.5%2095%2022.5%2095%2019.5%2086%2019.5%2086%2016.5%2095%2016.5%2095%2013.5%2086%2013.5%2086%2010.5%2095%2010.5'/%3e%3cpath%20class='st0'%20d='M40,1.5v21h11.6l1.4-1.4v-7.6h0c0,0-1.4-1.5-1.4-1.5l1.4-1.4V2.9l-1.4-1.4h-11.6ZM50,19.5h-7v-6h7v6ZM50,10.5h-7v-6h7v6Z'/%3e%3c/g%3e%3cpath%20class='st1'%20d='M23.1,24L14.7,4.8l-4.9,11.2h3.8l-1.8,4H3.3L12.1,0H2C.9,0,0,.9,0,2v20c0,1.1.9,2,2,2h21.1Z'/%3e%3cpath%20class='st2'%20d='M34,0h-16.8l10.6,24h6.2c1.1,0,2-.9,2-2V2C36,.9,35.1,0,34,0ZM32.5,20h-4V4h4v16Z'/%3e%3c/svg%3e)

Graphrag Visualizer
Overview :
GraphRAG Visualizer is a web-based tool designed for visualizing and exploring data generated by Microsoft's GraphRAG framework. GraphRAG is a technology developed by Microsoft for generating graph structure data. The GraphRAG Visualizer allows users to easily view and analyze data by uploading Parquet files, without the need for additional software or scripts. Key features include graphical visualization, tabular data representation, search capabilities, and local data processing, ensuring data security and privacy.
Target Users :
The target audience includes data scientists, researchers, and developers who need to visualize and analyze complex graph structure data generated by GraphRAG. The GraphRAG Visualizer provides an intuitive user interface, allowing users to explore and analyze data without requiring in-depth knowledge of the internal workings of GraphRAG.
Use Cases
Data scientists use GraphRAG Visualizer to analyze community structures in social networks.
Researchers utilize the tool to explore entity relationships in medical literature.
Developers employ GraphRAG Visualizer to test and debug the outputs of GraphRAG on a local server.
Features
Graphical Visualization: View graphs in 2D or 3D from the 'Graph Visualization' tab.
Data Tables: Display data from Parquet files in the 'Data Tables' tab.
Search Functionality: Comprehensive search support allows users to focus on specific nodes or relationships.
Local Processing: All data is processed locally on the user's machine, ensuring data security and privacy.
Automatic Loading of Parquet Files: Place Parquet files in the public/artifacts directory for automatic loading upon application startup.
Integration with GraphRAG API: While running the graphrag-api server, users can query the API server directly from the search interface in GraphRAG Visualizer.
Neo4j Cypher Logic: The relationship logic among text units, documents, communities, and covariates is derived from GraphRAG importing Neo4j Cypher notebooks.
How to Use
1. Clone the repository to your local machine: Use the git clone command to clone the GraphRAG Visualizer repository.
%20--%3e%3cdefs%3e%3cstyle%3e%20.st0%20{%20fill:%20%230080ff;%20}%20%3c/style%3e%3c/defs%3e%3cpath%20class='st0'%20d='M16.2,11.1c.4.5.4,1.2,0,1.8l-4.7,7.1h-3.8l5.3-8L7.6,4h3.8l4.7,7.1Z'/%3e%3c/svg%3e)
2. Install the necessary dependencies: Run the npm install command in the repository directory to install all dependencies.
3. Start the development server: Use the npm start command to launch the development server.
4. Open the application in your browser: Visit http://localhost:3000 to view the application.
5. Load Parquet files: Place the Parquet files in the public/artifacts directory; the application will automatically load and display these files.
6. Utilize the search functionality: After starting the graphrag-api server, query the API server through the search interface in GraphRAG Visualizer.

Featured AI Tools
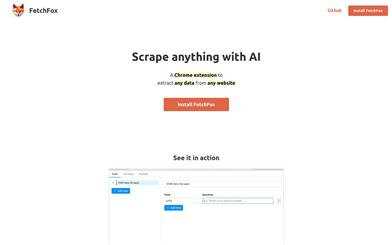
Fetchfox
FetchFox is an AI-driven web scraping tool. It leverages AI to extract the data you need from raw web pages. Running as a Chrome extension, users can simply describe the desired data in English. With FetchFox, you can quickly collect data such as building lead lists, gathering research data, or surveying market segments. By using AI to scrape from raw text, FetchFox can bypass anti-scraping measures on websites like LinkedIn and Facebook. It can easily parse even the most complex HTML structures.
Data Analysis
413.4K
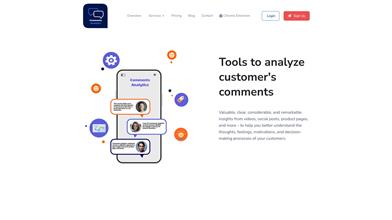
Comments Analytics
Comments Analyzer is a tool that helps users extract and analyze page comments. It utilizes artificial intelligence technology to extract and quantify emotional information from comments, providing functionalities such as sentiment analysis, entity recognition, and keyword extraction. By analyzing comments, users can understand customer thoughts, feelings, and decision-making processes, ultimately leading to improved customer experience and product or service optimization.
Data Analysis
316.8K