%20--%3e%3cdefs%3e%3cstyle%3e%20.st0%20{%20fill:%20%23061b40;%20}%20.st1%20{%20fill:%20%23306af1;%20}%20.st2%20{%20fill:%20%235ce5cf;%20}%20%3c/style%3e%3c/defs%3e%3cg%3e%3cpath%20class='st0'%20d='M55,10.5h9v3h-9v9h12V7.5h-12v3ZM64,19.5h-6v-3h6v3Z'/%3e%3cpolygon%20class='st0'%20points='69%2016.5%2078%2016.5%2078%2019.5%2069%2019.5%2069%2022.5%2081%2022.5%2081%2013.5%2072%2013.5%2072%2010.5%2081%2010.5%2081%207.5%2069%207.5%2069%2016.5'/%3e%3cpolygon%20class='st0'%20points='95%2010.5%2095%207.5%2083%207.5%2083%2022.5%2095%2022.5%2095%2019.5%2086%2019.5%2086%2016.5%2095%2016.5%2095%2013.5%2086%2013.5%2086%2010.5%2095%2010.5'/%3e%3cpath%20class='st0'%20d='M40,1.5v21h11.6l1.4-1.4v-7.6h0c0,0-1.4-1.5-1.4-1.5l1.4-1.4V2.9l-1.4-1.4h-11.6ZM50,19.5h-7v-6h7v6ZM50,10.5h-7v-6h7v6Z'/%3e%3c/g%3e%3cpath%20class='st1'%20d='M23.1,24L14.7,4.8l-4.9,11.2h3.8l-1.8,4H3.3L12.1,0H2C.9,0,0,.9,0,2v20c0,1.1.9,2,2,2h21.1Z'/%3e%3cpath%20class='st2'%20d='M34,0h-16.8l10.6,24h6.2c1.1,0,2-.9,2-2V2C36,.9,35.1,0,34,0ZM32.5,20h-4V4h4v16Z'/%3e%3c/svg%3e)

Visprex
Overview :
Visprex is an online tool focused on data visualization and analysis, allowing users to load CSV files directly in their browsers for local processing, ensuring data security. The product supports various datasets and provides multiple analytical views including histograms, scatter plots, and correlation matrices to help users gain a deeper understanding of the data. With its usability, robust data processing capabilities, and intuitive visual effects, Visprex serves as a vital tool for data analysts and researchers. The product background indicates that Visprex is designed to provide users with a secure and accessible platform for data analysis, enabling in-depth exploration without requiring complex programming knowledge.
Target Users :
Target audience includes data analysts, researchers, and professionals needing data analysis. With its intuitive interface and powerful data processing capabilities, Visprex enables even non-experts to conduct complex data analysis with ease, making it ideal for users who need to quickly understand and explore data.
Use Cases
Market researchers use Visprex to analyze consumer behavior data to optimize marketing strategies.
Biostatisticians leverage Visprex to explore correlations in different gene expression data.
Financial analysts utilize Visprex for visualizing stock market data to predict market trends.
Features
Supports loading various datasets, such as iris.csv, winequality-red.csv, etc.
Offers Histogram functionality to assist users in analyzing data distribution.
Provides Scatter Plot functionality for exploring correlations between variables.
Presents Correlation Matrix functionality to intuitively display correlations between variables.
Ensures local data processing to maintain user data privacy and security.
Offers comprehensive documentation support for easy user learning and usage.
Features a clean user interface, straightforward operations, and easy onboarding.
How to Use
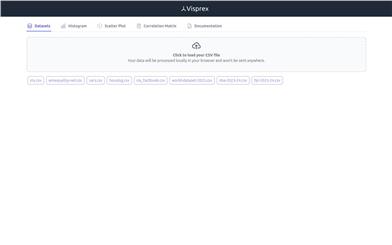
1. Visit the Visprex official website and click the 'Click to load your CSV file' button on the page.
%20--%3e%3cdefs%3e%3cstyle%3e%20.st0%20{%20fill:%20%230080ff;%20}%20%3c/style%3e%3c/defs%3e%3cpath%20class='st0'%20d='M16.2,11.1c.4.5.4,1.2,0,1.8l-4.7,7.1h-3.8l5.3-8L7.6,4h3.8l4.7,7.1Z'/%3e%3c/svg%3e)
2. Select a local CSV file to upload to Visprex.
3. After uploading, Visprex will automatically process the data and display a data preview on the page.
4. Click the 'Histogram', 'Scatter Plot', or 'Correlation Matrix' links at the top of the page to choose your desired type of data analysis.
5. Depending on the selected analysis type, Visprex will display the corresponding charts or matrices for users to analyze the data.
6. For further guidance on using Visprex, click the 'Documentation' link to view detailed information.
Featured AI Tools
English Picks
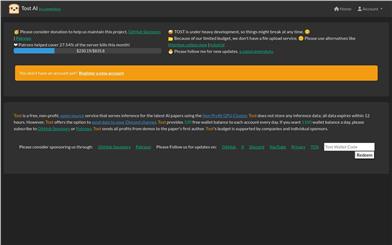
Tost AI
Tost AI is a free, non-profit, open-source service that provides inference for the latest AI research papers, utilizing a non-profit GPU cluster. Tost AI does not store any inference data; all data expires within 12 hours. Additionally, it offers the option to send data to a Discord channel. Each account receives 100 free wallet credits daily. If you wish to earn 1100 daily wallet credits, you can subscribe as a GitHub sponsor or through Patreon. All profits from Tost AI are directed to the first author of the papers, funded by corporate and individual sponsors.
Research tools
93.3K
Visprex
Visprex is an online tool focused on data visualization and analysis, allowing users to load CSV files directly in their browsers for local processing, ensuring data security. The product supports various datasets and provides multiple analytical views including histograms, scatter plots, and correlation matrices to help users gain a deeper understanding of the data. With its usability, robust data processing capabilities, and intuitive visual effects, Visprex serves as a vital tool for data analysts and researchers. The product background indicates that Visprex is designed to provide users with a secure and accessible platform for data analysis, enabling in-depth exploration without requiring complex programming knowledge.
Data analysis
51.3K