%20--%3e%3cdefs%3e%3cstyle%3e%20.st0%20{%20fill:%20%23061b40;%20}%20.st1%20{%20fill:%20%23306af1;%20}%20.st2%20{%20fill:%20%235ce5cf;%20}%20%3c/style%3e%3c/defs%3e%3cg%3e%3cpath%20class='st0'%20d='M55,10.5h9v3h-9v9h12V7.5h-12v3ZM64,19.5h-6v-3h6v3Z'/%3e%3cpolygon%20class='st0'%20points='69%2016.5%2078%2016.5%2078%2019.5%2069%2019.5%2069%2022.5%2081%2022.5%2081%2013.5%2072%2013.5%2072%2010.5%2081%2010.5%2081%207.5%2069%207.5%2069%2016.5'/%3e%3cpolygon%20class='st0'%20points='95%2010.5%2095%207.5%2083%207.5%2083%2022.5%2095%2022.5%2095%2019.5%2086%2019.5%2086%2016.5%2095%2016.5%2095%2013.5%2086%2013.5%2086%2010.5%2095%2010.5'/%3e%3cpath%20class='st0'%20d='M40,1.5v21h11.6l1.4-1.4v-7.6h0c0,0-1.4-1.5-1.4-1.5l1.4-1.4V2.9l-1.4-1.4h-11.6ZM50,19.5h-7v-6h7v6ZM50,10.5h-7v-6h7v6Z'/%3e%3c/g%3e%3cpath%20class='st1'%20d='M23.1,24L14.7,4.8l-4.9,11.2h3.8l-1.8,4H3.3L12.1,0H2C.9,0,0,.9,0,2v20c0,1.1.9,2,2,2h21.1Z'/%3e%3cpath%20class='st2'%20d='M34,0h-16.8l10.6,24h6.2c1.1,0,2-.9,2-2V2C36,.9,35.1,0,34,0ZM32.5,20h-4V4h4v16Z'/%3e%3c/svg%3e)

Claude Financial Data Analyst
Overview :
Claude Financial Data Analyst is a Next.js application that combines Claude AI capabilities with interactive data visualization, specifically designed for analyzing financial data. This product offers intelligent data analysis through chat, supports multi-format file uploads, and generates various charts based on the analysis. It is applicable not only in finance but also adaptable to areas like environmental data, sports performance, and social media analysis.
Target Users :
The target audience includes financial analysts, data scientists, environmental researchers, sports coaches, social media managers, and other professionals who need to analyze and visualize large datasets to make informed decisions.
Use Cases
Financial analysts use this product to analyze quarterly financial reports and market trends.
Environmental scientists utilize it to visualize pollution levels across different regions.
Sports coaches use it to track athlete performance and analyze team statistics.
Features
Intelligent Data Analysis: Provides text-based data analysis using Claude AI capabilities.
Multi-format File Upload Support: Allows uploading of text/code files, PDF documents, and images.
Interactive Data Visualization: Generates line charts, bar charts, multiple bar charts, area charts, stacked area charts, and pie charts based on the analysis.
Versatile Application Across Fields: Suitable for data analysis and visualization in various domains including environmental data, sports performance, and social media.
Data Extraction and Analysis: Upload financial documents to extract key metrics, analyze trends and patterns.
Visualization Creation: Generate charts based on data, customize visualizations, and compare multiple metrics.
Interactive Analysis: Get detailed insights into data by asking questions and requesting specific visualizations.
How to Use
1. Clone the code repository to your local machine.
%20--%3e%3cdefs%3e%3cstyle%3e%20.st0%20{%20fill:%20%230080ff;%20}%20%3c/style%3e%3c/defs%3e%3cpath%20class='st0'%20d='M16.2,11.1c.4.5.4,1.2,0,1.8l-4.7,7.1h-3.8l5.3-8L7.6,4h3.8l4.7,7.1Z'/%3e%3c/svg%3e)
2. Install the necessary dependencies.
3. Create a .env.local file containing your Anthropic API key.
4. Run the development server.
5. Open http://localhost:3000 in your browser to view the results.
6. Upload financial files or data.
7. Extract key metrics and analyze trends.
8. Generate and customize data visualizations as needed.


Featured AI Tools
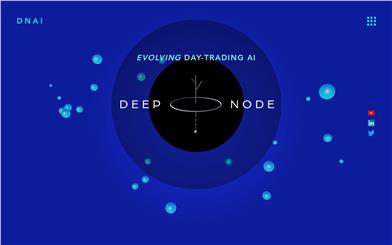
Deepnode
Deep Node has developed a stock short-term trading software based on AI evolutionary algorithms. The trading models in the software are alive and can adapt to constantly changing market conditions for profitable multi-asset short-term trading. Main functions include: 1. Evolutionary Computing Platform: Optimizes trading models through AI evolutionary algorithms; 2. Multicellular AI System: Simulates self-organizing systems to achieve more stable models; 3. Provides intelligent, architectural, and platform services to help users gain additional profits. The key advantage is that the trading model can evolve and adapt to the market in real-time, achieving stable profitability. It is positioned as a high-end stock trading assistant tool.
Finance
900.0K
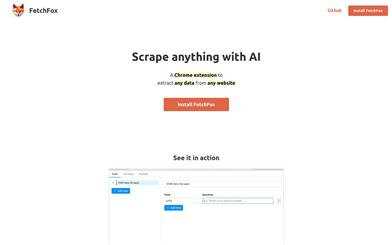
Fetchfox
FetchFox is an AI-driven web scraping tool. It leverages AI to extract the data you need from raw web pages. Running as a Chrome extension, users can simply describe the desired data in English. With FetchFox, you can quickly collect data such as building lead lists, gathering research data, or surveying market segments. By using AI to scrape from raw text, FetchFox can bypass anti-scraping measures on websites like LinkedIn and Facebook. It can easily parse even the most complex HTML structures.
Data Analysis
412.1K