%20--%3e%3cdefs%3e%3cstyle%3e%20.st0%20{%20fill:%20%23061b40;%20}%20.st1%20{%20fill:%20%23306af1;%20}%20.st2%20{%20fill:%20%235ce5cf;%20}%20%3c/style%3e%3c/defs%3e%3cg%3e%3cpath%20class='st0'%20d='M55,10.5h9v3h-9v9h12V7.5h-12v3ZM64,19.5h-6v-3h6v3Z'/%3e%3cpolygon%20class='st0'%20points='69%2016.5%2078%2016.5%2078%2019.5%2069%2019.5%2069%2022.5%2081%2022.5%2081%2013.5%2072%2013.5%2072%2010.5%2081%2010.5%2081%207.5%2069%207.5%2069%2016.5'/%3e%3cpolygon%20class='st0'%20points='95%2010.5%2095%207.5%2083%207.5%2083%2022.5%2095%2022.5%2095%2019.5%2086%2019.5%2086%2016.5%2095%2016.5%2095%2013.5%2086%2013.5%2086%2010.5%2095%2010.5'/%3e%3cpath%20class='st0'%20d='M40,1.5v21h11.6l1.4-1.4v-7.6h0c0,0-1.4-1.5-1.4-1.5l1.4-1.4V2.9l-1.4-1.4h-11.6ZM50,19.5h-7v-6h7v6ZM50,10.5h-7v-6h7v6Z'/%3e%3c/g%3e%3cpath%20class='st1'%20d='M23.1,24L14.7,4.8l-4.9,11.2h3.8l-1.8,4H3.3L12.1,0H2C.9,0,0,.9,0,2v20c0,1.1.9,2,2,2h21.1Z'/%3e%3cpath%20class='st2'%20d='M34,0h-16.8l10.6,24h6.2c1.1,0,2-.9,2-2V2C36,.9,35.1,0,34,0ZM32.5,20h-4V4h4v16Z'/%3e%3c/svg%3e)

Investment Strategy Simulator
Overview :
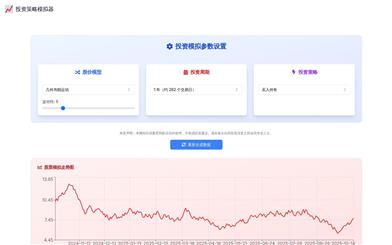
The Investment Strategy Simulator is an online tool that helps users understand the performance of various investment strategies under different market conditions by simulating different stock price models and investment strategies. It employs the Geometric Brownian Motion model to simulate continuous random fluctuations in stock prices, making it suitable for relatively stable blue-chip stocks. Users can customize different investment periods and strategies, such as buy-and-hold or dollar-cost averaging, to observe changes in investment returns. The main advantage of this tool is its simplicity and accessibility, allowing investors to learn and compare different investment strategies without incurring actual risks. It is ideal for long-term investors who remain calm and unaffected by short-term market fluctuations. Currently, this product is free, primarily aimed at educational and entertainment purposes, and does not constitute actual investment advice.
Target Users :
This tool is designed for investors, financial analysts, and learners interested in investment strategies. It is suitable for those looking to enhance their investment skills and understand market dynamics through simulation. Its intuitive interface and straightforward operation allow even novice investors to quickly get started.
Use Cases
Investors use the simulator to test a new investment strategy's performance on historical data.
Finance students use it to complete class projects on different investment strategies.
Experienced investors use it to compare the long-term returns of dollar-cost averaging and buy-and-hold strategies.
Features
Simulate stock price movements: Use the Geometric Brownian Motion model to simulate continuous random fluctuations in stock prices.
Set investment parameters: Users can customize investment periods, stock price models, and investment strategies.
Display stock simulation charts: Clearly show stock price changes during the simulation period.
Investment return graphs: Present the changes in investment returns over time visually.
Investment summary: Provide an overview of the stock price model, investment strategies, and returns.
Strategy comparison: Compare the returns and risk indicators of different investment strategies.
Simulated investment earnings report: Offer daily investment details, including stock price changes, amounts invested, total market value, etc.
How to Use
1. Open the Investment Strategy Simulator website.
%20--%3e%3cdefs%3e%3cstyle%3e%20.st0%20{%20fill:%20%230080ff;%20}%20%3c/style%3e%3c/defs%3e%3cpath%20class='st0'%20d='M16.2,11.1c.4.5.4,1.2,0,1.8l-4.7,7.1h-3.8l5.3-8L7.6,4h3.8l4.7,7.1Z'/%3e%3c/svg%3e)
2. Choose a stock price model, such as Geometric Brownian Motion.
3. Set the investment period, for example, one year.
4. Select an investment strategy, such as buy-and-hold.
5. Click the 'Regenerate Data' button to start the simulation.
6. View the stock simulation chart and investment return graph.
7. Analyze the investment summary and strategy comparison to evaluate the performance of different strategies.
8. Explore the simulated investment earnings report for detailed daily investment insights.


Featured AI Tools
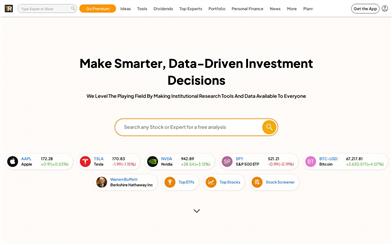
Tipranks
TipRanks is a financial information platform that offers stock market research, news, and analyst predictions. The platform allows users to view the track record and performance metrics of any analyst or author, helping users assess the reliability of the information. TipRanks Smart Score is based on backtesting results, but backtesting performance does not guarantee future actual results.
AI Stock Market Analysis
80.9K
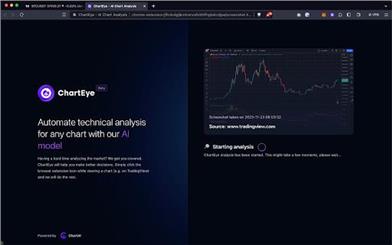
Charteye AI Chart Analysis
ChartEye is a plugin that provides AI-generated chart technical analysis. It uses advanced algorithms to quickly identify key patterns, trends, and potential trading signals, helping traders save time and improve decision-making accuracy.
AI Stock Market Analysis
68.7K