%20--%3e%3cdefs%3e%3cstyle%3e%20.st0%20{%20fill:%20%23061b40;%20}%20.st1%20{%20fill:%20%23306af1;%20}%20.st2%20{%20fill:%20%235ce5cf;%20}%20%3c/style%3e%3c/defs%3e%3cg%3e%3cpath%20class='st0'%20d='M55,10.5h9v3h-9v9h12V7.5h-12v3ZM64,19.5h-6v-3h6v3Z'/%3e%3cpolygon%20class='st0'%20points='69%2016.5%2078%2016.5%2078%2019.5%2069%2019.5%2069%2022.5%2081%2022.5%2081%2013.5%2072%2013.5%2072%2010.5%2081%2010.5%2081%207.5%2069%207.5%2069%2016.5'/%3e%3cpolygon%20class='st0'%20points='95%2010.5%2095%207.5%2083%207.5%2083%2022.5%2095%2022.5%2095%2019.5%2086%2019.5%2086%2016.5%2095%2016.5%2095%2013.5%2086%2013.5%2086%2010.5%2095%2010.5'/%3e%3cpath%20class='st0'%20d='M40,1.5v21h11.6l1.4-1.4v-7.6h0c0,0-1.4-1.5-1.4-1.5l1.4-1.4V2.9l-1.4-1.4h-11.6ZM50,19.5h-7v-6h7v6ZM50,10.5h-7v-6h7v6Z'/%3e%3c/g%3e%3cpath%20class='st1'%20d='M23.1,24L14.7,4.8l-4.9,11.2h3.8l-1.8,4H3.3L12.1,0H2C.9,0,0,.9,0,2v20c0,1.1.9,2,2,2h21.1Z'/%3e%3cpath%20class='st2'%20d='M34,0h-16.8l10.6,24h6.2c1.1,0,2-.9,2-2V2C36,.9,35.1,0,34,0ZM32.5,20h-4V4h4v16Z'/%3e%3c/svg%3e)

Mermaid Whiteboard
Overview :
Mermaid Whiteboard is a text-based charting tool developed by the team behind the award-winning open-source project Mermaid JS. It enables users to create a variety of charts, including flowcharts, sequence diagrams, Gantt charts, and more, through text. Mermaid Charts have revolutionized system design and training for new team members by streamlining documentation processes and enhancing workflow and communication efficiency among teams.
Target Users :
Mermaid Whiteboard is designed for engineers, project managers, systems analysts, and educators who need to create and share charts. Its text-driven automation and intuitive editor enhance the efficiency and manageability of system design and training new team members.
Use Cases
Engineers use Mermaid Whiteboard to design system architecture diagrams.
Project managers utilize it to create Gantt charts for project timelines.
Educators leverage it to develop instructional flowcharts.
Features
Text-based chart creation: Quickly create charts using Mermaid syntax.
Support for 17 chart types: Including flowcharts, sequence diagrams, class diagrams, etc.
Code snippets: Insert shapes, edges, or subgraphs directly with code snippets without needing additional coding.
Drag-and-drop, copy and paste, click-to-add: Offers an intuitive graphical user interface.
Plugin support: Extend Mermaid Chart functionality through plugins, such as the Visual Studio Code plugin.
Sharing and collaboration: Easily set permissions and share charts with others.
AI-generated summaries: Automatically generates summaries of charts after creation.
Visual editor: Provides both GUI and text-based editing options, suitable for all skill levels.
Chart repair: AI automatically fixes syntax errors.
Supports multiple themes: Such as default, forest, dark, neutral, etc.
Chart export: Supports various export formats, including PNG, SVG, MMD, and more.
How to Use
Visit the Mermaid Whiteboard website and register for a free account.
%20--%3e%3cdefs%3e%3cstyle%3e%20.st0%20{%20fill:%20%230080ff;%20}%20%3c/style%3e%3c/defs%3e%3cpath%20class='st0'%20d='M16.2,11.1c.4.5.4,1.2,0,1.8l-4.7,7.1h-3.8l5.3-8L7.6,4h3.8l4.7,7.1Z'/%3e%3c/svg%3e)
Choose to create a new chart or edit an existing one.
Use the text editor to input Mermaid syntax or the visual editor to create charts via the GUI.
Leverage code snippets for quick addition of chart elements.
Adjust charts through drag-and-drop, copy and paste, or click-to-add actions.
Utilize the AI Chat feature by entering descriptions for the AI to generate charts.
Fix any syntax errors using the chart repair feature.
Set sharing permissions for collaboration with others.
Export charts in desired formats such as PNG or SVG.
Featured AI Tools
Chinese Picks

Capcut Dreamina
CapCut Dreamina is an AIGC tool under Douyin. Users can generate creative images based on text content, supporting image resizing, aspect ratio adjustment, and template type selection. It will be used for content creation in Douyin's text or short videos in the future to enrich Douyin's AI creation content library.
AI image generation
9.0M
Outfit Anyone
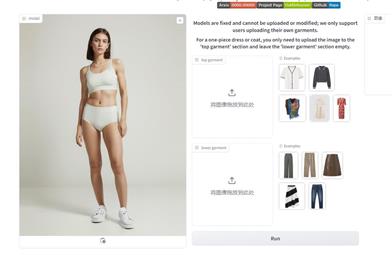
Outfit Anyone is an ultra-high quality virtual try-on product that allows users to try different fashion styles without physically trying on clothes. Using a two-stream conditional diffusion model, Outfit Anyone can flexibly handle clothing deformation, generating more realistic results. It boasts extensibility, allowing adjustments for poses and body shapes, making it suitable for images ranging from anime characters to real people. Outfit Anyone's performance across various scenarios highlights its practicality and readiness for real-world applications.
AI image generation
5.3M