%20--%3e%3cdefs%3e%3cstyle%3e%20.st0%20{%20fill:%20%23061b40;%20}%20.st1%20{%20fill:%20%23306af1;%20}%20.st2%20{%20fill:%20%235ce5cf;%20}%20%3c/style%3e%3c/defs%3e%3cg%3e%3cpath%20class='st0'%20d='M55,10.5h9v3h-9v9h12V7.5h-12v3ZM64,19.5h-6v-3h6v3Z'/%3e%3cpolygon%20class='st0'%20points='69%2016.5%2078%2016.5%2078%2019.5%2069%2019.5%2069%2022.5%2081%2022.5%2081%2013.5%2072%2013.5%2072%2010.5%2081%2010.5%2081%207.5%2069%207.5%2069%2016.5'/%3e%3cpolygon%20class='st0'%20points='95%2010.5%2095%207.5%2083%207.5%2083%2022.5%2095%2022.5%2095%2019.5%2086%2019.5%2086%2016.5%2095%2016.5%2095%2013.5%2086%2013.5%2086%2010.5%2095%2010.5'/%3e%3cpath%20class='st0'%20d='M40,1.5v21h11.6l1.4-1.4v-7.6h0c0,0-1.4-1.5-1.4-1.5l1.4-1.4V2.9l-1.4-1.4h-11.6ZM50,19.5h-7v-6h7v6ZM50,10.5h-7v-6h7v6Z'/%3e%3c/g%3e%3cpath%20class='st1'%20d='M23.1,24L14.7,4.8l-4.9,11.2h3.8l-1.8,4H3.3L12.1,0H2C.9,0,0,.9,0,2v20c0,1.1.9,2,2,2h21.1Z'/%3e%3cpath%20class='st2'%20d='M34,0h-16.8l10.6,24h6.2c1.1,0,2-.9,2-2V2C36,.9,35.1,0,34,0ZM32.5,20h-4V4h4v16Z'/%3e%3c/svg%3e)

Infography
Overview :
Infography is a platform that leverages artificial intelligence technology to transform complex blog articles into visually appealing and easy-to-share infographics. It assists marketers, educators, and influencers in attracting new audiences, effortlessly reusing content, and engaging potential customers by simplifying information, enhancing engagement, and increasing shareability. Key benefits include simplifying complex information, enhancing engagement and shareability, capturing attention on social media, promoting specific products or services, reusing existing content, and improving SEO.
Target Users :
Target audience includes content creators, educators, influencers, and marketing agencies. These user groups often need to present complex information in a more engaging way to enhance content appeal and shareability. Infography enables these users to quickly create infographics through easy-to-use AI tools, thereby increasing their online impact and engagement.
Use Cases
Gabe Fletcher used Infography to post an infographic on LinkedIn, significantly increasing post visibility.
Jottrled created visual learning materials using Infography, enhancing content appeal and readability.
learnagilepractices considers Infography an effective tool for converting blog posts into social media-friendly images.
Features
Convert blog articles into infographics, simplifying complex information.
Enhance the visual appeal of content, increasing user engagement and shareability.
Capture attention on social media, boosting brand awareness.
Highlight key features and benefits of products or services.
Reuse existing blog posts without the need for new content creation.
Improve search engine rankings by embedding keywords within infographics.
How to Use
Visit the Infography official website and register an account.
%20--%3e%3cdefs%3e%3cstyle%3e%20.st0%20{%20fill:%20%230080ff;%20}%20%3c/style%3e%3c/defs%3e%3cpath%20class='st0'%20d='M16.2,11.1c.4.5.4,1.2,0,1.8l-4.7,7.1h-3.8l5.3-8L7.6,4h3.8l4.7,7.1Z'/%3e%3c/svg%3e)
Choose an infographic template that suits your blog content.
Upload your blog post, and the AI will assist in converting it into an infographic.
Adjust the text, colors, and other design elements of the infographic as needed.
Preview the infographic to ensure all information is accurate.
Download the generated infographic and share it on your social media platforms or website.
Analyze sharing data to understand which types of content are more popular and optimize future infographic designs.
Featured AI Tools
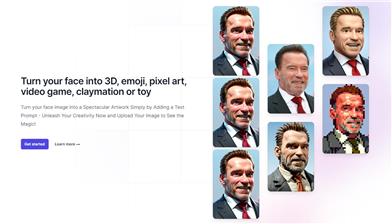
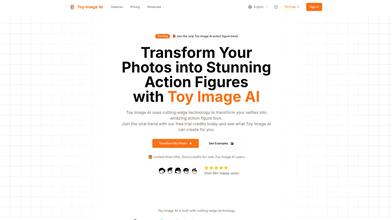
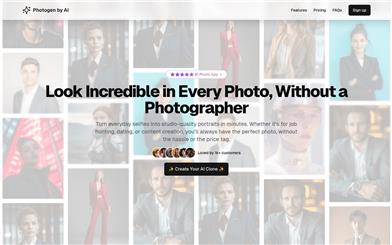
Face To Many
Face to Many can transform a facial photo into multiple styles, including 3D, emojis, pixel art, video game style, clay animation, or toy style. Users simply upload a photo and choose the desired style to effortlessly create amazing and unique facial art. The product offers various parameters for user customization, such as noise intensity, prompt intensity, depth control intensity, and InstantID intensity.
Image Generation
4.8M
English Picks
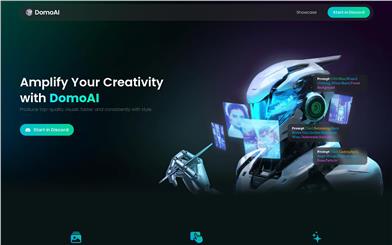
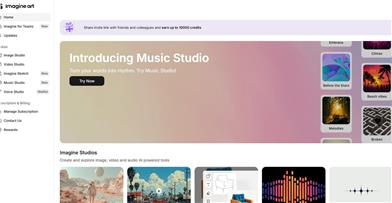
Domoai
DomoAI is an image creation tool that offers a variety of pre-set AI models, allowing users to effortlessly achieve a consistent artistic style across all their projects. Its user-friendly and efficient design enables quick mastery, helping users craft exceptional visual assets. With DomoAI, users can experiment quickly and efficiently, boosting their creativity. Additionally, DomoAI's text-to-art feature transforms imagination into reality in just 20 seconds, bringing anime dreams to life.
Image Generation
2.7M