%20--%3e%3cdefs%3e%3cstyle%3e%20.st0%20{%20fill:%20%23061b40;%20}%20.st1%20{%20fill:%20%23306af1;%20}%20.st2%20{%20fill:%20%235ce5cf;%20}%20%3c/style%3e%3c/defs%3e%3cg%3e%3cpath%20class='st0'%20d='M55,10.5h9v3h-9v9h12V7.5h-12v3ZM64,19.5h-6v-3h6v3Z'/%3e%3cpolygon%20class='st0'%20points='69%2016.5%2078%2016.5%2078%2019.5%2069%2019.5%2069%2022.5%2081%2022.5%2081%2013.5%2072%2013.5%2072%2010.5%2081%2010.5%2081%207.5%2069%207.5%2069%2016.5'/%3e%3cpolygon%20class='st0'%20points='95%2010.5%2095%207.5%2083%207.5%2083%2022.5%2095%2022.5%2095%2019.5%2086%2019.5%2086%2016.5%2095%2016.5%2095%2013.5%2086%2013.5%2086%2010.5%2095%2010.5'/%3e%3cpath%20class='st0'%20d='M40,1.5v21h11.6l1.4-1.4v-7.6h0c0,0-1.4-1.5-1.4-1.5l1.4-1.4V2.9l-1.4-1.4h-11.6ZM50,19.5h-7v-6h7v6ZM50,10.5h-7v-6h7v6Z'/%3e%3c/g%3e%3cpath%20class='st1'%20d='M23.1,24L14.7,4.8l-4.9,11.2h3.8l-1.8,4H3.3L12.1,0H2C.9,0,0,.9,0,2v20c0,1.1.9,2,2,2h21.1Z'/%3e%3cpath%20class='st2'%20d='M34,0h-16.8l10.6,24h6.2c1.1,0,2-.9,2-2V2C36,.9,35.1,0,34,0ZM32.5,20h-4V4h4v16Z'/%3e%3c/svg%3e)

Interactive Graph By LLM
Overview :
Target Users :
This product is intended for data analysts, business decision-makers, and anyone who needs to visually represent data. It simplifies the data visualization process, helping users quickly understand and communicate complex data, particularly in business environments that require efficient data presentation and analysis.
Use Cases
A data analyst uses this tool to quickly generate a chart of countries ranked by GDP
A market research professional utilizes it to showcase product sales trends
An educator employs it to explain statistical data to students
Features
Supports natural language queries, such as 'Top 10 countries by GDP'
Users can adjust chart settings by clicking on elements on the canvas
Provides graphical search prompts to help users build queries more efficiently
Real-time generation of interactive charts enhances data readability and comprehension
Clickable chart elements offer deeper data exploration
Supports multiple data visualization formats to cater to diverse user needs
How to Use
Visit the Interactive Graph by LLM website
%20--%3e%3cdefs%3e%3cstyle%3e%20.st0%20{%20fill:%20%230080ff;%20}%20%3c/style%3e%3c/defs%3e%3cpath%20class='st0'%20d='M16.2,11.1c.4.5.4,1.2,0,1.8l-4.7,7.1h-3.8l5.3-8L7.6,4h3.8l4.7,7.1Z'/%3e%3c/svg%3e)
Enter a natural language query in the search box, for example, 'Top 10 countries by GDP'
Adjust chart settings as needed, such as colors and labels
Click on chart elements to reveal further details
Leverage the chart for data exploration and analysis
Share or export the generated chart for use in reports or presentations

Featured AI Tools
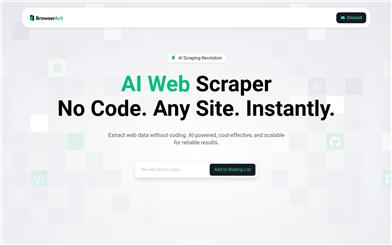
Fetchfox
FetchFox is an AI-driven web scraping tool. It leverages AI to extract the data you need from raw web pages. Running as a Chrome extension, users can simply describe the desired data in English. With FetchFox, you can quickly collect data such as building lead lists, gathering research data, or surveying market segments. By using AI to scrape from raw text, FetchFox can bypass anti-scraping measures on websites like LinkedIn and Facebook. It can easily parse even the most complex HTML structures.
Data Analysis
413.4K
Comments Analytics
Comments Analyzer is a tool that helps users extract and analyze page comments. It utilizes artificial intelligence technology to extract and quantify emotional information from comments, providing functionalities such as sentiment analysis, entity recognition, and keyword extraction. By analyzing comments, users can understand customer thoughts, feelings, and decision-making processes, ultimately leading to improved customer experience and product or service optimization.
Data Analysis
316.8K