%20--%3e%3cdefs%3e%3cstyle%3e%20.st0%20{%20fill:%20%23061b40;%20}%20.st1%20{%20fill:%20%23306af1;%20}%20.st2%20{%20fill:%20%235ce5cf;%20}%20%3c/style%3e%3c/defs%3e%3cg%3e%3cpath%20class='st0'%20d='M55,10.5h9v3h-9v9h12V7.5h-12v3ZM64,19.5h-6v-3h6v3Z'/%3e%3cpolygon%20class='st0'%20points='69%2016.5%2078%2016.5%2078%2019.5%2069%2019.5%2069%2022.5%2081%2022.5%2081%2013.5%2072%2013.5%2072%2010.5%2081%2010.5%2081%207.5%2069%207.5%2069%2016.5'/%3e%3cpolygon%20class='st0'%20points='95%2010.5%2095%207.5%2083%207.5%2083%2022.5%2095%2022.5%2095%2019.5%2086%2019.5%2086%2016.5%2095%2016.5%2095%2013.5%2086%2013.5%2086%2010.5%2095%2010.5'/%3e%3cpath%20class='st0'%20d='M40,1.5v21h11.6l1.4-1.4v-7.6h0c0,0-1.4-1.5-1.4-1.5l1.4-1.4V2.9l-1.4-1.4h-11.6ZM50,19.5h-7v-6h7v6ZM50,10.5h-7v-6h7v6Z'/%3e%3c/g%3e%3cpath%20class='st1'%20d='M23.1,24L14.7,4.8l-4.9,11.2h3.8l-1.8,4H3.3L12.1,0H2C.9,0,0,.9,0,2v20c0,1.1.9,2,2,2h21.1Z'/%3e%3cpath%20class='st2'%20d='M34,0h-16.8l10.6,24h6.2c1.1,0,2-.9,2-2V2C36,.9,35.1,0,34,0ZM32.5,20h-4V4h4v16Z'/%3e%3c/svg%3e)

Excel Dashboard AI
Overview :
Excel Dashboard AI is a tool that leverages artificial intelligence to rapidly convert Excel data into interactive dashboards and analytical reports. By utilizing natural language processing capabilities, it allows users to communicate with their data conversationally to quickly gain insights. Key advantages of the product include the rapid generation of diverse analytical dimensions, the ability to edit and refine analysis perspectives in natural language, one-click interactive dashboard creation, AI interpretation of chart meanings, and conversion of dashboards into detailed analytical reports.
Target Users :
The target audience for Excel Dashboard AI primarily consists of business professionals, data analysts, and corporate decision-makers who need to quickly derive insights and reports from large datasets. It is suitable for users looking to enhance data processing efficiency, streamline the reporting workflow, and present data in a visually intuitive manner.
Use Cases
Business analysts use Excel Dashboard AI to quickly generate sales data dashboards for presenting key metrics in meetings.
Data scientists leverage this tool to explore various data dimensions and identify potential market trends.
Corporate decision-makers utilize dashboards to receive real-time data updates, enabling more informed business decisions.
Features
Transform Excel into dashboards and reports within two clicks using AI technology.
Engage in natural language dialogues with data to gain instant insights.
Facilitate batch analysis and easily explore different data dimensions.
Create customized data dashboards with a single click.
Instantly generate data analysis reports.
Obtain immediate answers from AI by asking questions.
Explore diverse data dimensions with AI, providing 10 different analytical dimensions to choose from.
Effortlessly generate new charts using natural language commands and add them to the dashboard.
Download dashboards as comprehensive data analysis reports with editable charts.
How to Use
Register and log in to the Excel Dashboard AI website.
%20--%3e%3cdefs%3e%3cstyle%3e%20.st0%20{%20fill:%20%230080ff;%20}%20%3c/style%3e%3c/defs%3e%3cpath%20class='st0'%20d='M16.2,11.1c.4.5.4,1.2,0,1.8l-4.7,7.1h-3.8l5.3-8L7.6,4h3.8l4.7,7.1Z'/%3e%3c/svg%3e)
Upload or link your Excel data file.
Engage with your data using natural language, asking questions or specifying dimensions you wish to analyze.
Select and edit the analysis dimensions of interest based on the results provided by the AI.
Generate interactive dashboards with a single click, making adjustments and customizations as needed.
Download the dashboard as a comprehensive data analysis report for further sharing or presentation.


Featured AI Tools
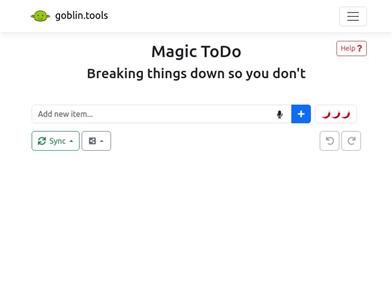
Magic ToDo
Magic ToDo is a standard to-do list with special features. It can automatically generate task steps based on the spiciness you set. The spicier the level, the more steps generated. You can use emojis to indicate the spiciness level of the task. The tool will also automatically assign a category to the top tasks, represented by emojis. You can use filter buttons to filter tasks of one or multiple categories. In addition, each task provides common task tools such as editing, deleting, adding subtasks, and estimating. You can drag and drop the left side icons to reorder tasks. The tool also offers other operations for the entire list, including device synchronization, export options, undo and redo, and batch operations.
Efficiency Tools
1.3M
English Picks
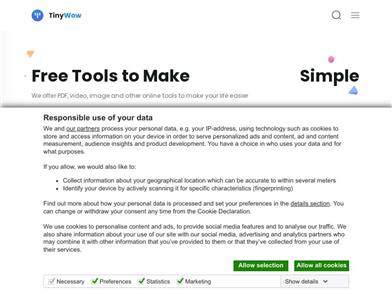
Tinywow
TinyWow is a website that provides a suite of free online tools encompassing PDF editing, image processing, AI writing, and video processing. It empowers users to tackle various work and life challenges without requiring registration or usage restrictions.
Efficiency Tools
671.0K